Throughout my career as a developer, I’ve relied heavily on open source. Without GitHub, I wouldn’t be a quarter as productive as I am now. And yet, embarrassingly enough, it wasn’t until last year that I made my first open-source contribution. I had wanted to contribute for a long time, but choosing a project, understanding the codebase, finding the source of a bug, and communicating with maintainers all felt too daunting. Then, by chance, I ended up contributing to an open-source project for the first time and realized it wasn’t nearly as hard as I had imagined.
The open source project I participated in was Telegraf. The name may sound unfamiliar, but it is a well-known project in the monitoring area. When you think of monitoring, you probably think of server monitoring (IaaS level monitoring) and application monitoring (APM), and Telegraf is a metrics collection agent that is active in server monitoring.
Monitoring typically goes something like this: collect -> store -> analyze -> visualize. (Sometimes the order changes a bit along the way.) Here, Telegraf is in charge of the collection phase. You could say that its positioning is similar to that of metricbeat in the Elastic stack.
Comparing the Elastic stack to the TICK stack in the monitoring area, the Elastic stack, with its flow of Beat -> Logstash -> Elasticsearch -> Kibana, is basically based on log monitoring. Of course, nowadays, Elasticsearch has expanded its scope to application-level monitoring by creating not only logs and metrics but also APM.
The TICK stack, on the other hand, can be thought of as metric-based monitoring. The difference between a metric and a log is that a log is simply a string of messages, while a metric is a numerical value. Telegraf itself is specialized in collecting metrics, and its data repository, InfluxDB, is built as a database for storing time series data.
When we talk about the TICK stack, we mean a stack made up of Telegraf, InfluxDB, Chronograf, and Kapacitor, but Chronograf is rarely used for visualization in practice. In fact, Grafana offers more as a visualization tool and integrates better with other data sources, so the TIG (Telegraf - InfluxDB - Grafana) stack seems more common. The problem is that Grafana works better with Prometheus than with the TICK stack, and in today’s container-based ecosystem Prometheus is more popular anyway. Both are written in Go. Honestly, in the container world these days, eight out of ten tools seem to be written in Go. It feels like Go is becoming the de facto language of that ecosystem.
Anyway, to cut a long story short, Telegraf is, as I said, a metrics collection agent. But there’s always one more qualifier attached to Telegraf: it’s “plugin-based.” Telegraf can collect many different kinds of metrics through many different plugins. And you’re not limited to sending those collected metrics to InfluxDB. Through other output plugins, you can send them to entirely different kinds of data stores as well.
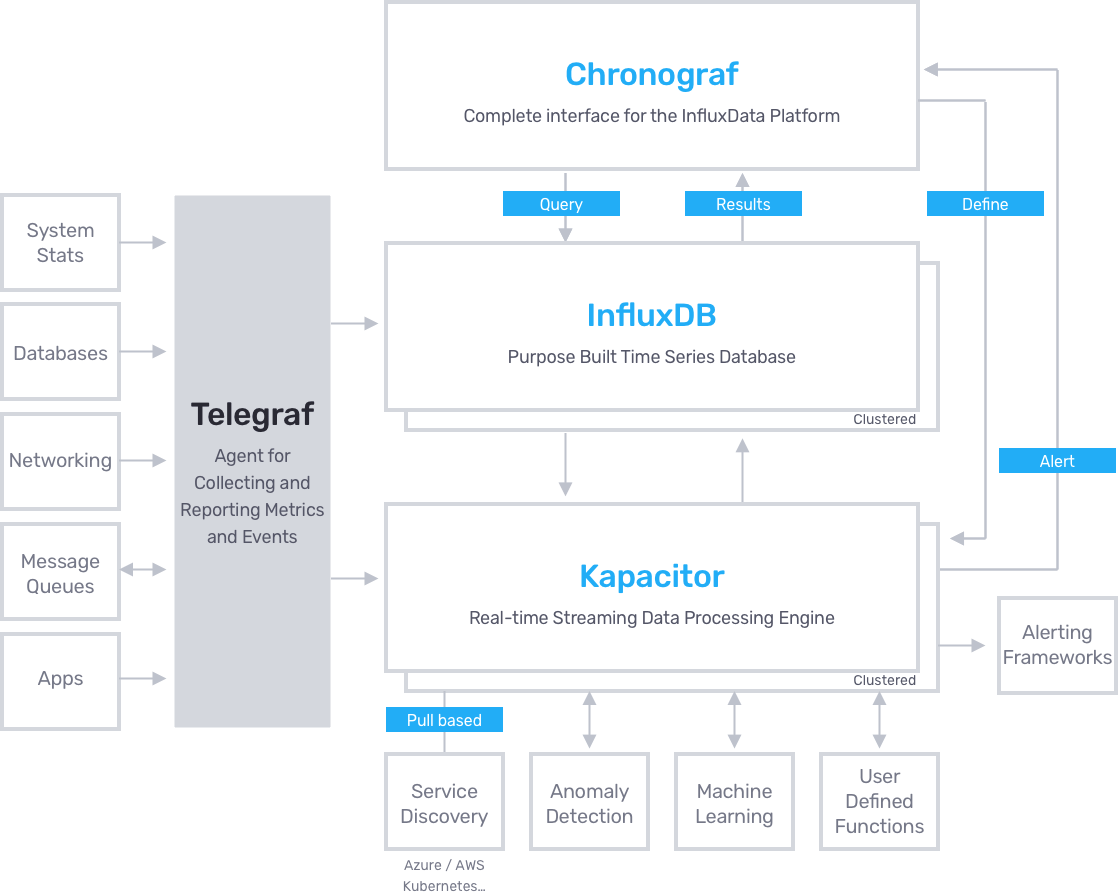
The picture above is from Telegraf’s official webpage and shows the architecture of the TICK stack in detail. (As a side note, when I checked at the end of last year, the picture said something about “200+ plugins supported”, but when I checked, it was actually 198). Anyway, the list of plugins supported by Telegraf can be found in the README on the Telegraf Github, and as of today’s master branch, it looks like this
- Input Plugins: activemq, aerospike, amqp_consumer, apache, aurora, aws cloudwatch, bcache, beanstalkd, bind, bond, burrow, cassandra, ceph, cgroup, chrony, cisco_telemetry_gnmi, cisco_telemetry_mdt, cloud_pubsub, cloud_pubsub_push, conntrack, consul, couchbase, couchdb, cpu, DC/OS, diskio, disk, disque, dmcache, dns query time, docker, docker_log, dovecot, ecs, elasticsearch, exec, fail2ban, fibaro, file, filestat, filecount, fireboard, fluentd, github, graylog, haproxy, hddtemp, httpjson, http_listener, http_listener_v2, http, http_response, icinga2, influxdb, influxdb_listener, internal, interrupts, ipmi_sensor, ipset, iptables, ipvs, jenkins, jolokia2, jolokia, jti_openconfig_telemetry, kafka_consumer, kapacitor, kinesis, kernel, kernel_vmstat, kibana, kubernetes, kube_inventory, leofs, linux_sysctl_fs, logparser, lustre2, mailchimp, mcrouter, memcached, mem, mesos, minecraft, mongodb, mqtt_consumer, multifile, mysql, nats_consumer, nats, neptune_apex, net, net_response, netstat, nginx, nginx_plus_api, nginx_plus, nginx_upstream_check, nginx_vts, nsq_consumer, nsq, nstat, ntpq, nvidia_smi, openldap, opensmtpd, openweathermap, pf, pgbouncer, phpfpm, phusion passenger, ping, postfix, postgresql_extensible, postgresql, powerdns, powerdns_recursor, processes, procstat, prometheus, puppetagent, rabbitmq, raindrops, redis, rethinkdb, riak, salesforce, sensors, smart, snmp_legacy, snmp, socket_listener, solr, sql server, stackdriver, statsd, swap, syslog, sysstat, system, tail, temp, tcp_listener, teamspeak, tengine, tomcat, twemproxy, udp_listener, unbound, uswgi, varnish, vsphere VMware vSphere, webhooks, filestack, github, mandrill, papertrail, particle, rollbar, win_perf_counters, win_services, wireless, x509_cert, zfs, zipkin, zookeeper
- Parsers: InfluxDB Line Protocol, Collectd, CSV, Dropwizard, FormUrlencoded, Graphite, Grok, JSON, Logfmt, Nagios, Value, Wavefront
- Serializers: InfluxDB Line Protocol, JSON, Graphite, ServiceNow, SplunkMetric, Carbon2, Wavefront
- Processor Plugins: converter, date, enum, override, parser, pivot, printer, regex, rename, strings, topk, unpivot
- Aggregator Plugins: basicstats, final, histogram, minmax, valuecounter
- Output Plugins: influxdb, influxdb_v2, amon, amqp (rabbitmq), application_insights, aws kinesis, aws cloudwatch, azure_monitor, cloud_pubsub, cratedb, datadog, discard, elasticsearch, file, graphite, graylog, health, http, instrumental, kafka, librato, mqtt, nats, nsq, opentsdb, prometheus, riemann, riemann_legacy, socket_writer, stackdriver, syslog, tcp, udp, wavefront
Without going into too much detail about Telegraf, I use it as part of my job at work. Previously, we were using it to collect metrics from our Linux-based servers, but we needed to add support for Windows servers as well. Telegraf supports Windows, so it was no problem to install and start testing. However, Linux and Windows have different ways of collecting metrics, so I had to get a different configuration file for Windows than for Linux servers.
However, as I quickly skimmed through the config file, I noticed something strange.
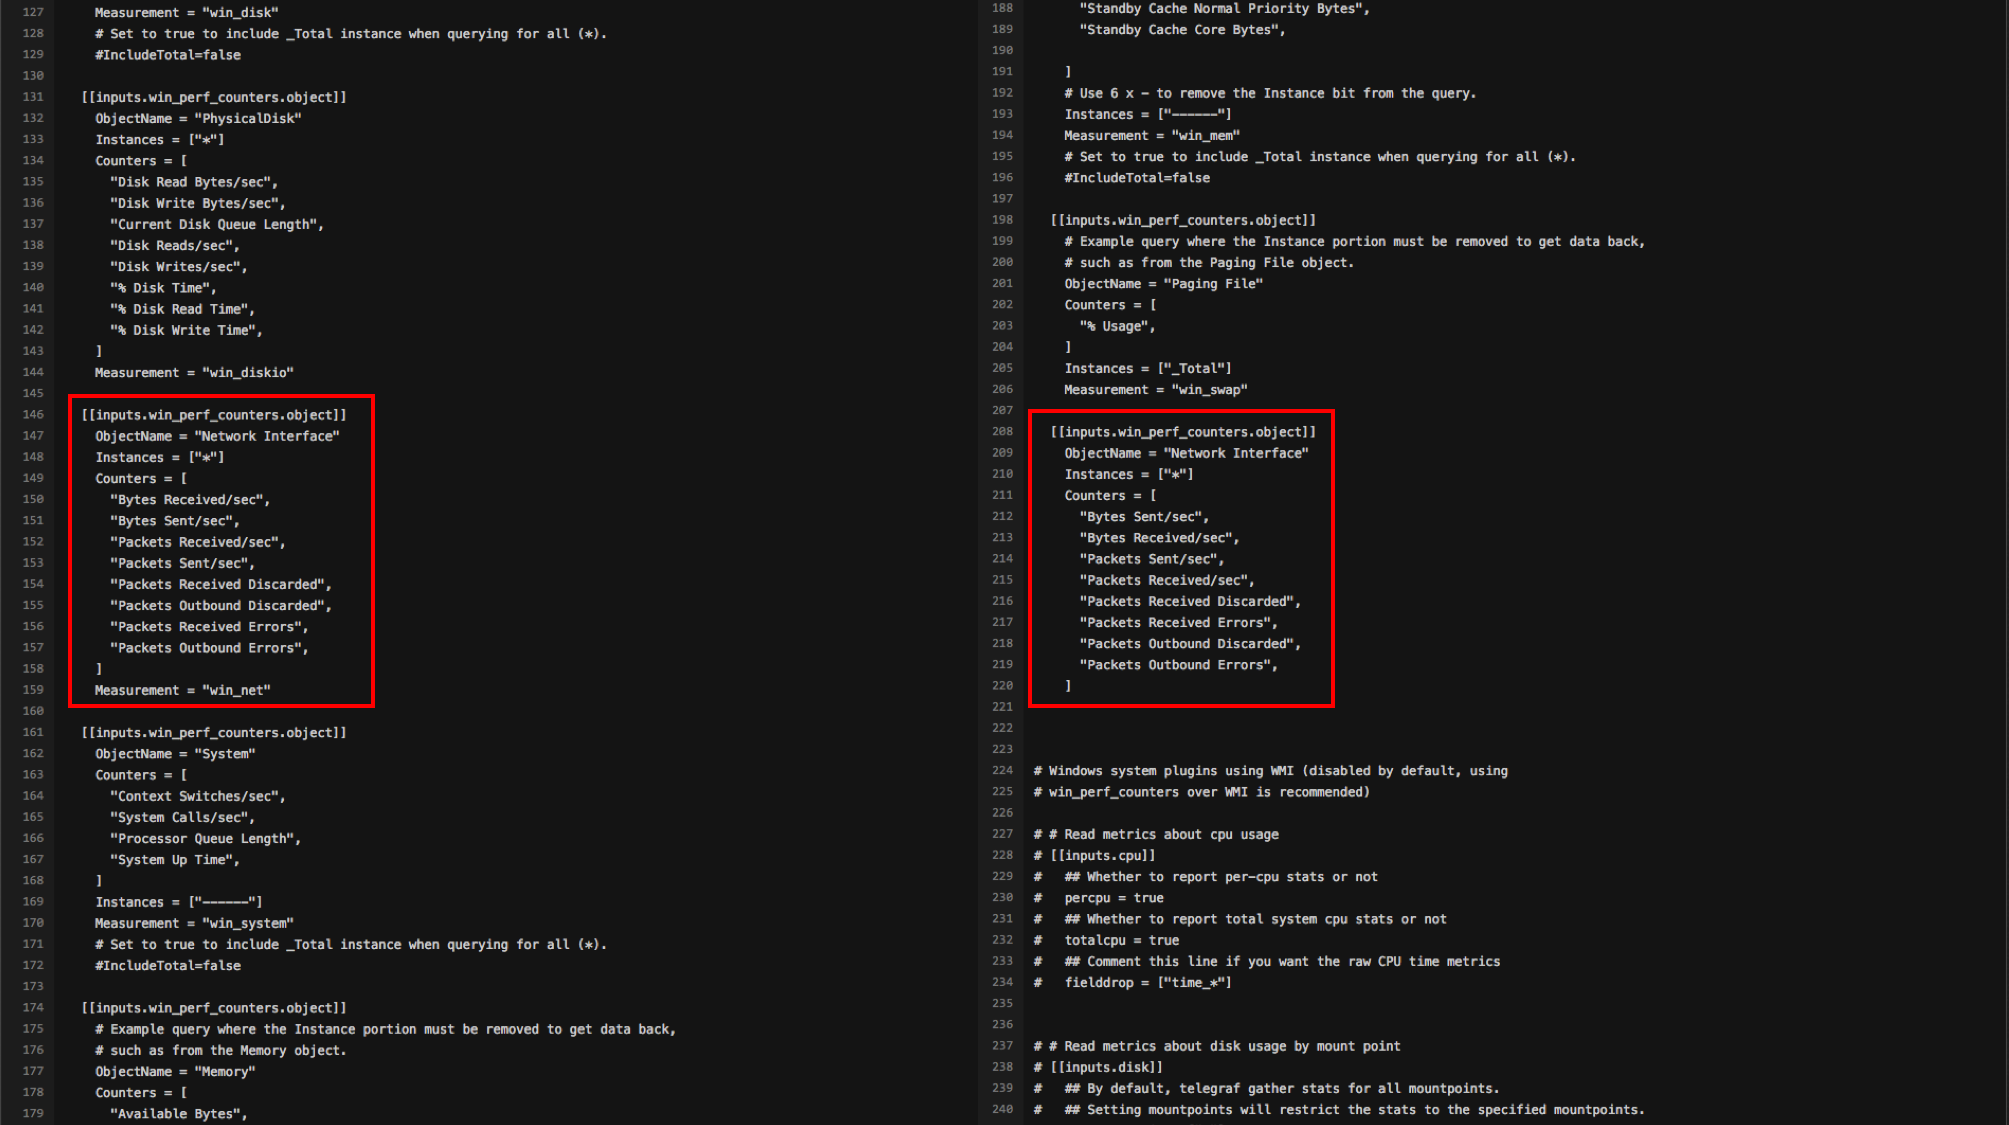
I think I saw a setting to collect network-related metrics once at the top of the configuration file, but I found it again below. Normally, it’s easy to think “I must have done something wrong” rather than “Telegraf’s default configuration file is wrong”. Naturally, I thought I must have made a mistake when pasting it, so I got a new one for Windows. However, the new configuration file also had duplicate sections.
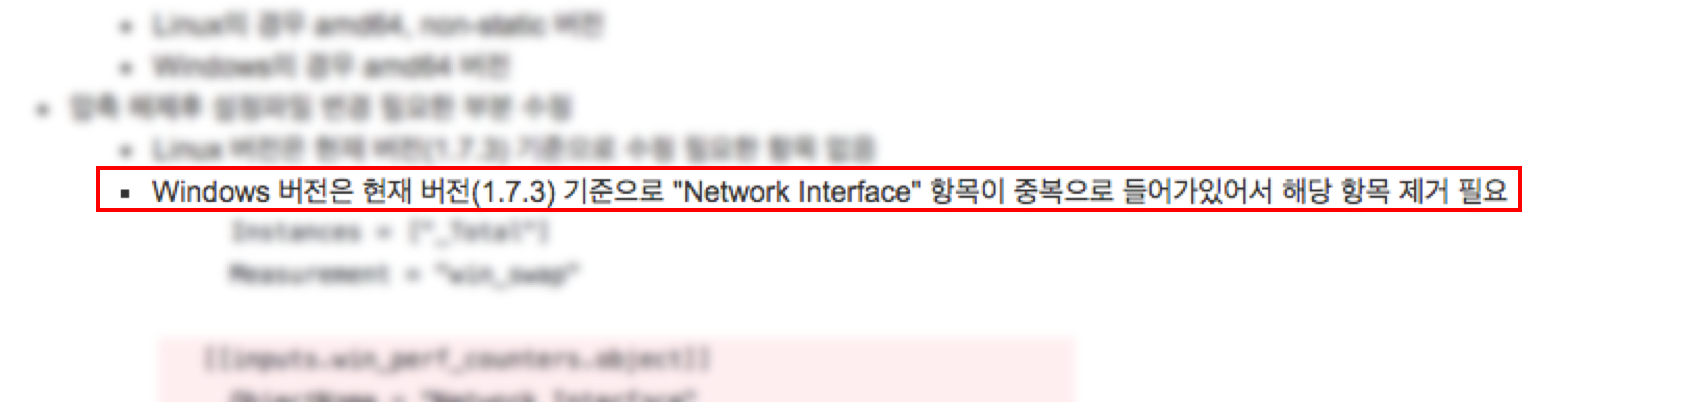
I realized that the default configuration file was wrong, so I added the note above to our internal Telegraf guide. Then it occurred to me that this was an easy chance to land a PR. I immediately opened a PR removing the duplicate configuration, and because it was such an obvious error, it was merged without any trouble. The maintainer left a simple comment: “Thanks!”
That comment made me feel a little strange. I’d spent years coding day and night, but I had never heard someone thank me for something I wrote, even if this particular contribution was just a simple configuration fix. Of course, the company makes money from the code I write, but that doesn’t mean anyone thanks me for it. Instead, they pay me, which in this case is obviously the better deal.
I realized that I wanted to contribute more to the Telegraf project.
In fact, as I mentioned above, I’ve tried to contribute to open source a few times before. But I definitely didn’t have the right approach.
- I want to contribute to open source…
- I want to do something big and famous…
- clone a big and famous open source project.
- find the main function and follow it from the beginning…. Give up after 3 minutes.
- find the official documentation and read through it…. Give up after 30 minutes.
- check out a very early version of the project and follow the source again…. Give up after 5 minutes.
- give up.
I actually think this is a very bad approach to contributing to open source. In fact, I think it’s best to choose an open source project to contribute to from the ones you’re already using. For me, Telegraf was one of those things, and there were a few other things I could play around with.
- a program you actually use
- implemented in the familiar Go language
- Plugin-based, easy to understand and modify code
- Each plugin has README documentation for easy understanding
Of these, number 3 in particular was very valid. Since it’s literally plugin-based, I didn’t need to look at any other code unless I was touching the core part of Telegraf, I only needed to look at the code of the plugin I wanted to fix, and in most cases, the plugin is all contained in one or two files. The documentation is also very detailed about what interface the plugin should have, which makes it easier to follow the code.
Even better, when using Go, I often struggle with how to write tests, but in Telegraf’s case, the test files are well organized, so it’s easy to get the hang of writing tests. (In fact, you can’t merge without tests.)
Additionally, if you’re the author of a new plugin, you’ll be credited in the release notes, as shown below.
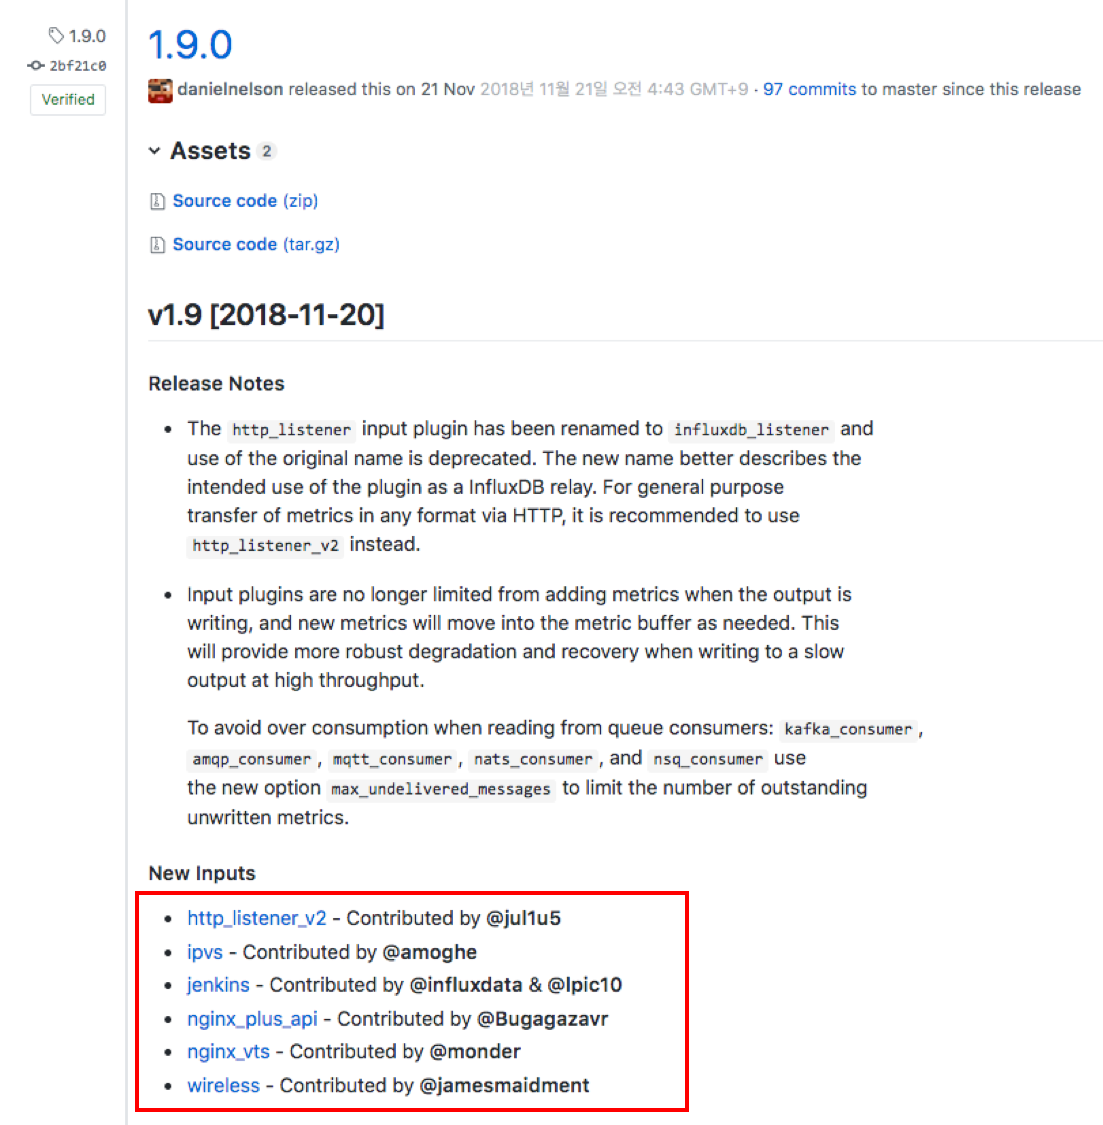
I’ve only made bugfix type contributions so far, so I haven’t gotten my name listed here. But I hope to do so soon.
2019-09-04 Added,
Success!